Search This Blog

Monday, November 11, 2013

Tigo Energy Maximizer


Tigo Energy Maximizer

So I've finally got my Tigo system working.  It took a while for Greenspring Energy to get it running.  Part of the issue was that there was a communication issue with 2 (of 6) panels.  This communication issue for some reason meant that TIGO would not generate my login information.  That also confirmed a suspicion I had after I was watching the inverter (before Tigo and TED) only produce ~1.1 kW of power on a beautiful cloudless sunny day.  Once the communication issue was fixed (Greenspring sent over 2 technicians to diagnose and fix) the system was up and running at nearly maximum potential.  And I could finally login to Tigo.

So...why Tigo?  Well, long story short, Tigo was an alternative to microinverters such as Enphase.  It essentially allows each panel to operate individually such that if there was any shading (i.e. trees, squirrels, random cloud) then it would only affect that panel and not the entire string.  My two pics below show how the TIGO is allowing my system to have panels operating at different powers which is maximizing my power output.
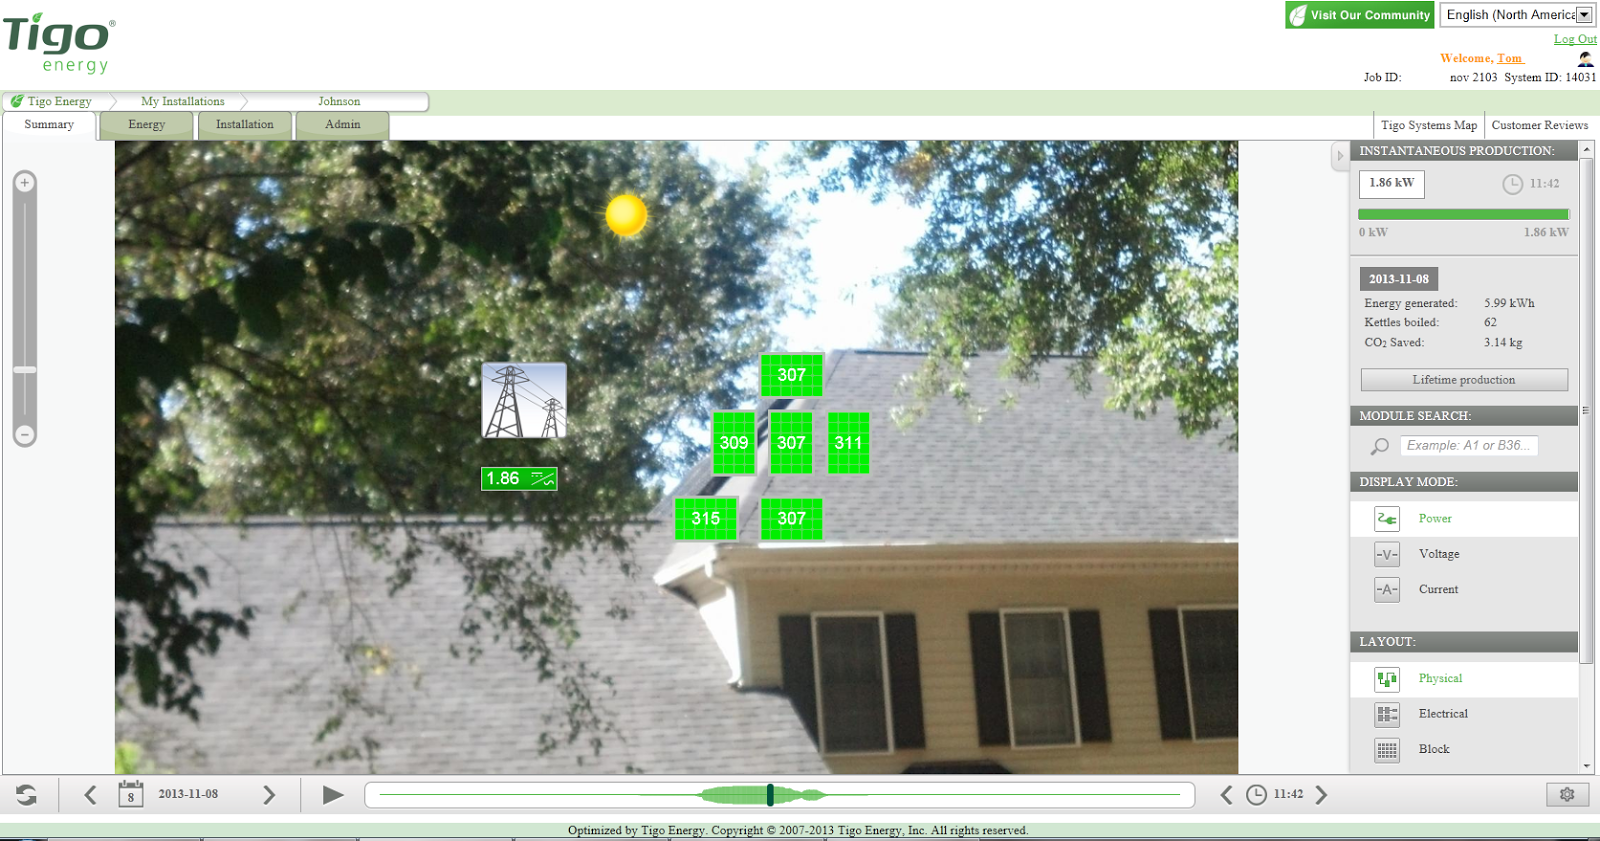
Tigo online information (no shading).  System is producing 94.8% of its max potential. 

Tigo online information showing one panel shaded.  Without Tigo, I would have been producing 474W instead of 1,510W
***WARNING***
***NERDY ELECTRICAL ENGINEERING LESSON STARTING NOW***
Why is that?  Well...solar panels are wired in series.  So on one 300W panel, for instance, let's say we have 60 individual solar cells.  Each one of those cells, at optimal conditions would produce 5W such that 60 x 5W = 300W.  Well, because they are wired in series, if one cell becomes partially shaded and only produces 1W, then due to the bottle-neck, ALL the cells will only produce 1W (1W x 60 = 60W).  It doesn't matter if that cells is the first cell or the last cell in the series...then will all be bottle-necked.  And the same goes for hooking up multiple solar panels.  Bummer, huh?

The reason they do this is just the laws of electricity (I know there's a better name, but I don't have time to look it up).  So Power = Voltage x amperage.  Well for the same power, if you hook everything up in parallel, then the voltage remains constant.  Thus as you add more 'power', then the amperage must go up.  Alternatively, if you install everything in series, the amperage stays the same and thus, as power goes up, voltage goes up. 

So why not hook up panels in parallel?  Well...the more amperage you have the larger the wire you need to have.  Ever look in your breaker box?  Check out the varying size of the wires.  The wires that enter the box from your electricity meter are HUGE (200 amps, 240V) compared to those that exit and go to, say, a normal outlet (120V, 15amp).  Well...think about that for each solar panel.  Those wires cannot be 'fished' easily through walls or down conduit.  And those wires are expensive because there's a lot of copper in them.  See the following table (sorry for the headings not lining up with the rows...not sure why it copied that way).  Most likely your house is fed using either and 2/0 or 3/0 AWG cable while a normal circuit in your house is probably a 10 or a 14 AWG.

AWG
 Diameter 
inches
mm
Area
[mm2]
Resistance
Ohms / 1000 ft
Resistance
** Ohms / km
 Max Current
***
Max Frequency
for 100%
skin depth
0000 (4/0) 
0.46
11.684
107
0.049
0.16072
302
125 Hz
000 (3/0)
0.4096
10.40384
85
0.0618
0.202704
239
160 Hz
00 (2/0)
0.3648
9.26592
67.4
0.0779
0.255512
190
200 Hz
0 (1/0)
0.3249
8.25246
53.5
0.0983
0.322424
150
250 Hz
4
0.2043
5.18922
21.2
0.2485
0.81508
60
650 Hz
6
0.162
4.1148
13.3
0.3951
1.295928
37
1100 Hz
8
0.1285
3.2639
8.37
0.6282
2.060496
24
1650 Hz
10
0.1019
2.58826
5.26
0.9989
3.276392
15
2600 Hz
14
0.0641
1.62814
2.08
2.525
8.282
5.9
6700 Hz

Well a 10 AWG wire might be $1/ft at Lowes while a 2/0 AWG wire is $6.50/ft.  That's a big cost difference if you have to run a wire 100-ft to get from the roof to your breaker box.  And at 0.50" DIA try bending that 2/0 wire to get around a corner. 

Just doing the math, using the pic above where the panels were producing 1.86 kW, that's roughly 310W/panel or 52V @ 6amp.  Running in series, that's a 6amps and 310V using a 10 AWG wire.  Running in parallel that's 52V @ 36 amps which would require a 4 AWG wire.

OK...enough of the electrical engineering lesson.  Hopefully it was semi-informative even though it was basic.


Friday, November 8, 2013

Too much excitement not to share...

Screenshot from my TED5000

OK...so this week I received my extra TED5000 MTU and clamps and installed them so I can finally see what I'm producing.  It took me a bit to figure out how to get it setup appropriately though.  Once I installed the unit and checked with the software, all my readings went negative (it was 8pm at night...no sunshine). I double checked my installation and it was all appropriate.  Then I read in the forums, that I needed to removed and flip the clamps on the 'whole house' wires and that did the trick.  Once I did that then the readings were all correct.  Then, it was cloudy.  Dang!  Well, today the sun is shining brightly and I'm finally getting to see my system producing power (I knew it was, but now I can see it remotely).  Yes...I am a nerd.

From the screenshot above (11am EST) my system was producing 1.702kW while peak production is 1.962kW while I was only using about 100W, so I'm sending power to the grid, baby!  

Sometime today I should get my login information for TIGO and I'll post on that.  I'll save that saga for another post, but long story short, there was a communication error from 2 of my panels (~660W NOT producing) and Greenspring energy had to send out a technician to fix it (all panels are now producing power).  With that fixed, TIGO can communicate and I'll be able to view the real time info on each panel.  

Monday, November 4, 2013

Energized!


View of my solar panels
So my panels are up and running.  Last Thursday the folks came out and flipped the switch to start producing power.  And of course it had to be an overcast day.  And the next day it rained.  Such a bummer.  However, last weekend (and today) the sun is shining and I'm producing some power!  I checked it multiple times this weekend and I myself producing about 1.1 kW of power. Cool!

Zero Watts.  So disappointing...
The Tigo system is hooked up as well.  I can't say much about it because I still haven't gotten my login information so I can view what's going on.  And the unit at my house won't give me any information until it connects with their servers online.  What a drag!  Greenspring told me this was supposed to be done Thursday and I'd get the login information on Friday.  Well...it's Monday and still nothing.

Tigo Unit not telling me anything.  Boring...
Overall, I'm happy with the install.  That being said, I have a couple of critiques for Greenspring Energy:

1)  Be honest with the payback.  They gave me the information from PVWatts, install costs, and then estimated an ROI.  Here's what they didn't provide:
    a)  No Tax was included.  That was another ~$500 on top of the install cost.  $500 is roughly 2 years on the ROI.
    b)  Be realistic with the Duke Energy rate increases.  They used 5%/yr.  Yeah...that works for the last, oh 5 years.  But long term, it's been closer to 2%/yr.
    c)  If you conduct a solar eye, then adjust your power generation numbers! I had to ask if they did a solar eye and then ask for the results.  When I read the results, I found out that the actual estimate for power was 20% lower than what PV Watts was estimating, because it assumes an unimpeded ideal southern exposure.  I don't have that.
   d)  Solar panels degrade.  It's even one of the selling points by Sunpower...that it retains ~95% of its power after 5 years and 85% after 25 years.  That's a 0.25%/yr degradation (industry standard = 1%/yr).  Fantastic...well you gotta include those calculations in your ROI!  
   e)  Overall, my ROI was estimated at 13 years.  There's was much better.  Anybody Surprised?
   f)  Hopefully this changes, as I showed them the U.S. DOE System Adviser Model (SAM).  This model includes all the information I note above (except rate increases as user entered).

2)  I would've thought a high priced install would have looked nicer?  The panels themselves look nice\, but some of the other aspects could have been more professional looking.
  a) Below are some pictures with the install.  I'm a little disappointed that I now have a long conduit pipe running down the side of my house.  I will say that at least it's kind of hidden as it runs along the soffit. I'm probably going to have to paint it so it will blend in a little better.  Granted my breaker box isn't exactly located in the easiest place to get at. But, I will say that the wires could have been run down to the crawl space and then come out to the inverter.  I can't complain too much about it.  It definitely could have looked worse.  Judge for yourselves:
Conduit running along the side of the house to the inverter
  b) Next is the TIGO install.  Check out the wires.  Looks like of sh*tty, right?  When they were there I inquired about the wiring and they were offering to get one of those cheap-o black cord holders.  Appropriate thought, I'll give them credit.  But seriously...make it look nice.  Thus, why I went and purchased the nice wire hiding stuff.  And I may go further and have it go into the wall first, and then pop out and run along the base.  I'm not sure yet

Tigo wiring At least they put on wire ties, right?


Then there's where they came through the wall to hook up the communication to the panels via ethernet (gray wire). They ran it through the upper attic, then down to the bonus room attic knee wall (like I did when I wired the house for ethernet).  However, they just cracked my base plate and ran their wire behind mine.  Really?  You couldn't spend the $2 to buy a new plate to run it through?  And then in my bonus room attic, I spent a lot of time and effort putting up XPS insulation and sealing everything.  They just drilled a hole and ran the wire through...leaving a direct hole from the attic to my bonus room.  Couldn't even take the time to put at least piece of HVAC tape over it?!? (I did that temporarily)  Well...once I get the wire chase installed, I've already bought the new plate with the hole where I'll have the wire will run through.  And when that's done, I'll fill in the hole with the XPS with great-stuff foam.  I think I may still have ethernet materials left over....and if I do I may install an ethernet jack instead to make it look much more professional.

Wire coming through the back of the plate.

Once I get the TIGO login information, I'll post about it.  It's pretty cool stuff.

Oh...and I had to buy another adapter kit for my TED 5000.  Apparently it won't register less than zero...or I should say when it does it still reads a positive value.  So to correct my TED readings, I've had to spend $100 on a new MTU (transmitting unit) so I can measure the PV generation individually and then TED will subtract those values from my overall to give me a net (+/-) value.  I'm a little disappointed in this, but oh well.  I should have looked this up previously.

Stay tuned for more fun info!  

Tuesday, October 15, 2013

Solar Panels Installed!

the panels on my roof
Oh...its so exciting!  My solar panels were installed today.  No generation yet as i need to wait for the County inspection followed by Duke Energy's inspection and net meter hook-up.  They'll also hook up the TIGO at the same time.  So i have to wait a week or so.  Below are some pics to enjoy for now.
getting the inverter ready

Getting started on the roof


Final Inverter Installation

Final Panel Installation


My case for going solar

So as I alluded to in my last post, I've decided on installing some solar panels on my roof.

Spoiler alert!

(The panels were just installed today...but I've procrastinated on posted my internal justification.  The pics of the install will be in my next post.)

OK, so I've done a large variety of energy efficiency projects on my house including (in no particular order):

3) Lots of air sealing
7) Ecobee thermostat to optimize my HVAC operation
9) Installed all CFL and LED light bulbs
10) Got a HERs rating.  And then updated it after working on the suggestions.
11) Etc

So yeah, I've done a lot on the ole' house.  And the results have shown a substantial reduction in my home energy usage:  45.6% reduction since 2010.

After all those reductions, I finally got to a point that all the most cost effective upgrades/fixes were completed.   So what's next?  Well...generating my own power.  

I had gotten a quote in the past (here) which indicated that I could put up roughly 1.962 kW on the small area of south facing roof I have.  Here's the numbers of how it would pan out (from GreenSpring Energy):

1)  Solar panels (installation, permits, etc):  $10,791
2)  TIGO Maximizing system (to reduce issues with shading): $785
3)  Tax:  $503
4)  SubTotal:  $12,079
5)  Federal Tax Credit:  - $3,624
6)  State Tax Credit:  - $4,228
7)  Net Cost to Me:  $4,228

The system should produce roughly 2,577 kWh/year AFTER correcting for my shading issues.  That's being pretty conservative given that the SolarEye makes the calculation with leaves on the trees...when truthfully during the winter, I'll get more production than it estimates.  And the TIGO should help give it a boost (10-20%) by allowing for each panel to produce its own power rather than have shade on one panel affect the entire array.  Regardless, let's stick with the conservative estimate.  That ~2,600 kWh is worth roughly $296.  So the simple ROI is $4,228/296 = 14.3 years.  Using the DOE SAM tool (System Advisor Model) gives me 13.3 years as it factors in a lot more.  

Then there's the how much my home value will theoretical increase.  I realize that's "funny money" unless I actually sell the house...but factoring that in (20x the annual savings is what's considered the value) then that's ~$6000, so that would say the system has already paid for itself.  Again...funny money.

So another thing I thought about was "what if I got an electric car?"  It's true that the gasoline equivalent value of electricity is greater than the actual electricity equivalent.  So how would that work?  

Well...from Aug 2012 to Aug 2013, I spent $1,186 on gas for the ole' Prius.  So that could be some good savings.  Let's assume we compare my Prius to a Nissan Leaf:

Annual mileage = 12,000/yr
Prius = 48 mpg
Leaf = 34 kWh/100 miles
Gas Cost = $3.50/gallon
Electricity Cost = $0.115/kWh

Prius Annual Cost = $875 ($0.073/mile)
Leaf Annual Cost = $469 ($0.039/mile)
Savings = $406/year!

So getting an electric car itself is pretty cost effective...and I haven't even factored in the maintenance advantage (no oil changes for the Leaf).  So what happens with the addition of solar panels?  Well, for accounting purposes, let's say say that the additional driving energy for the Leaf is offset by the solar panel production.  Then we get...

Leaf Annual Electricity Consumed = 4,080 kWh
Solar Generation = 2,557 kWh
Remaining Power to be Purchased = 1,503 kWh
Revised Leaf Annual Cost = $173 ($0.0144/mile)
Revised Annual Savings = $702/year.

So I nearly triple the savings.  That takes the ROI to:  $4,228/702 = 6 years.

Wow...so I can cut the ROI in half if I take advantage of the solar + an electric car.  
Yes, I'm sure some nay-sayers will ask about financing the car.  However, I will note that I'm in the market for a car anyway (Jan 2014).  And after federal tax credits the Leaf (~$24k) is already the same price point as what I bought my Prius for ($24k).  So I'm assuming that nets-out.  Could I stick with the Prius?  Sure...but it's going on 108 kmiles right now which is creeping into that unknown maintenance.

What about range anxiety?  Yup, I'd certainly have to think about when/where I'd go and the charge I have.  But then again, my trips have gotten a lot smaller now that I kiddos have arrived.  For those work trips, I can just rent a car in lieu of driving my car.  Or I could just drive my wife's Mazda5.  The long family trips will be in the Mazda5...and that's why be bought it because we needed to haul the two of us, the twins, luggage, and (sometimes) the dog.

So yeah... I think this will work out.   And just think...if I can get my work to let me charge then the savings add up even more.  Or maybe I'll have to find a way to use those 5 charging stations at the light rail station nearby.  

Monday, October 7, 2013

October Energy Bill. Up yet still Down


September  2013 Energy Usage

Wow...what a wondrous month its been.  The kiddos are certainly keeping me busy and slightly sleep deprived.  But it's getting better.  Every week they are sleeping a little more during the night.   As I mentioned last month, I knew my energy usage was going to sky-rocket.  But I think it's been manageable.  While overall, my energy usage for this month compared to last is up by 45% (see detailed info below), I was expecting much worse.  Let's show the Bill results first:

October 2012 (Sept 5 - Oct 2) --> Blog Post Here

Total Energy Consumption = 409 kWh
No. of Days = 28
Average Daily Energy Consumption = 14.61 kWh/day
Bill = $49.91


October 2013 (Sept 4 - Oct 2)

Total Energy Consumption = 595 kWh
No. of Days = 28
Average Daily Energy Consumption = 21.25 kWh/day (45.5% INCREASE in consumption)
Bill = $68.13

Looks bad right?  However, October 2012 was also one of my lowest energy usage months ever too.  Much of my usage was in the first half of the month (see the Pic above) where I was using about 30 kWh/day.  That was all HVAC usage as I needed to keep the house around 72F for the kiddos.  Halfway through the month I was able to turn the system off because the nighttime temperatures were cool enough to allow me to open up the windows at night and use "super fan" to cool the house.  

So I asked myself...how does it compare to October 2011?  The geothermal was still installed, just not the GE Geospring.  So here's that comparison:

October 2011 (associated blog post here)

Total Energy Consumption = 771 kWh
No. of Days = 32
Average Daily Energy Consumption = 24.09 kWh/day
Bill = $79.75

So 2013 was a 11.8% DECREASE in energy consumption compared to 2011.  Now, there's some savings.
So in about a week, I'm getting 1.962 kW of solar panels installed.  I chose to go this route since I believe I've done what I can practically on the energy efficiency side of my home.  All that work resulted in roughly a 50% decrease in my annual energy consumption (compared to 2010 when I moved in) .  Only after all of that work was done would I consider energy generation.

Overall, the solar panels should produce roughly 1/3 of my annual power usage.  I have a limited southern roof exposure so that was part of it of not trying to get more.  I could always add more panels in the future, but they would have to go on my West Facing roof.  Stay tuned next week for that blog posting.  I'll also include my math on ROI.


Friday, September 13, 2013

September Energy Bill...Life has changed.

Well, it's September and another month has passed.  This time a lot has changed.  On August 16 at 9:16am, my twins were born:  Lillian Hope and Connor Thomas.
Connor Thomas
Lillian Hope

Needless to say, a lot has changed in my household.  For the purposes of my blog, we'll just focus on the electricity usage.  Wow...it's increased just a wee bit.  Yes, there's some sarcasm in there.  I need to hold the temperature in my house to 72F which is chewing up a good bit of energy.  And I'm washing/drying at least 2-3x more than normal.  Such little clothes...but boy it adds up fast!  And then there's hot water usage form having to hand wash bottles every 3 hours.

All I can say is that it's a dang good thing I worked hard on all my energy efficiency work prior!  The GE Geospring water heater in conjunction with the geothermal desuperheater has been TONKA.  FYI, running the A/C more results in more desuperheater usage, thus more hot water generation.

Anyhow, my September Bill results are below.  I'm skipping the HDD/CDD analysis because I don't have time to do it.  Maybe I'll come back later and add it back in.

September 2012  (Aug 3 - Sept 5)
Total Consumed:  816 kWh
Days in Month:  33
Avg Daily Consumption:  24.73 kWh/day
Bill:  $91.17

September 2013 (Aug 2 - Sept 4)
Total Consumed:  771 kWh
Days in Month:  33
Avg Daily Consumption:  23.36 kWh/day (5.5% reduction from 2012)
Bill:  $84.14 (~$7 savings vs 2012)

So, I still realized a savings versus 2012.  Although I only had the babies home for less than half the month.  September is already looking like a blow-out.  According to TED, I've used 390 kWh (Avg 33.33 kWh/d) and we're only 13 days in.  Last year, I used 409 kWh for the entire month.  Yeah...it's going to be a big value.

I will say that I am looking at solar panels again.  I still need to convince myself that they are worthwhile.  Right now, it's looking like a 13-yr ROI only looking at energy reduction.  If I include increase in home value that plummets to 1 year.  But I guess it all depends on what you believe for numbers.


Thursday, August 8, 2013

August Energy Bill

My Demo'd Laundry Room

Well another month of summer has passed and fall is looming.  I've been busting my butt making sure everything is ready for the impending arrival of the twins.  And somehow I got the bright idea to renovate my laundry room to a mudroom.  Now, I will admit that I had been talking about it for a while, but just hadn't 'pulled the trigger' on it.  I guess I saw this as my last opportunity so I had better get moving!

Without further delay, below is my energy results...

August 2012 Bill
Total consumption:  758 kWh
Number of Days:  30
Average Daily Consumption:  25.27 kWh/day
Cooling Degree Days:  517
Energy Consumption per CDD:  1.47 kWh/CD
2012 Bill:  $85.62

August 2013 Bill
Total consumption:  631 kWh
Number of Days:  31
Average Daily Consumption:  20.35 kWh/day (19.44% reduction from 2012)
Cooling Degree Days:  394
Energy Consumption per CDD:  1.60 kWh/CD (9.23% increase from 2012)
2012 Bill:  $70.78 (Bill Savings:  $14.84)

What's interesting about this month is that while I show a nearly 20% reduction in energy usage, the cooler than normal weather had a high influence as shown by the ~9% increase in consumption per CDD.  This is mainly because my pregnant wife has taken full control over the A/C.  I've found the A/C down to 72F at times...as compared to the set point of 77F.  But she gets the benefit of the doubt on this one since she's carrying around 2 little ones.

Looking at the Ecobee stats for the geothermal system, last month had the following:

Upstairs
Runtime:  152 hrs
Runtime per CDD:  0.41 hrs/CDD
Avg Indoor Temperature:  74.7F
Avg Outdoor Temperature:  85F

Downstairs
Runtime:  53 hrs
Runtime per CDD:  0.14 hrs/CDD
Avg Indoor Temperature:  75.6F
Avg Outdoor Temperature:  85F
 
So....can you guess which thermostat my wife has latched onto?  Yeah...she likes it nice and cool when she sleeps.  There's times I wake up and I'm cold!  This is not the way it normally is.  But, in about a week, maybe we'll be able to allow the thermostat to stay at some normal temperatures..just .maybe...

Thursday, July 11, 2013

July Energy Bill

Hi Folks...yes, I realize it's been a while, but to be honest, I don't have any energy efficiency projects in the que. Well..proejcts that I can install myself anyway.   Maybe that's a good thing, right?  I get to enjoy my days after spending countless hours plunging myself into fixing things.  And now I'm enjoy the fruits of my work. 

Speaking of the 'fruits of my work'...below is the latest Energy bill results...

July 2012 Bill 
Total Energy Consumption = 663 kWh
Total number of days = 29
Average Daily Energy Consumption = 22.86 kWh/day
Bill Total = $76.00
Cooling Degree Days = 300
Avg Consumption per CDD = 2.21 kWh/CDD

July 2013 Bill  (Jun 4 - Jul 2)
Total Energy Consumption = 462 kWh
Total number of days = 28
Average Daily Energy Consumption = 16.50 kWh/day (27.8% Reduction from 2012)
Bill Total = $54.62 ($18.72 savings compared to 2012)
Cooling Degree Days = 313
Avg Consumption per CDD = 1.48 kWh/CDD (33.2% Reduction from 2012)

Overall...I'm still averaging about a 22% reduction in energy since installing the new GE Geospring ASHP water heater.  Not bad, eh? I know its still early in the season, but since I've started running my A/C, I've seen about a 35% reduction in energy usage.  This would be the result of the water heater work (RE:  Using the two tanks in series) in addition to the Ecobee thermostat allowing me to only run Stage 1 only which is significantly (30%) more efficeint than allowing Stage 2 to operate even when you factor in Stage 1's longer run time.  Cool stuff, huh?

So what's new on the horizon?  Well, not much to be honest.  I'm still very interested in installing solar panels.  But I need to refill the ole' piggy bank as we just bought my wife a new car for the soon-to-arrive twins.  And once they arrive, I'll expect my energy bill to go up as: (1) My wife + kids will be home for the next 3 motnhs, (2) My mother and father-in-law will be visiting and (3) I can't allow my house temperature to fluxuate as much.  The kiddos will need 75-78F (summer) and 68-70F (winter). Not to mention the extra hot water I'll need for clothes washing\drying, baths, dishwashing, etc.

I won't be too disappointed though...because I know I've worked my butt off to make sure I had everything as efficient as feasibly possible before the kids arrived.

Until next month...

Thursday, June 6, 2013

June Energy Bill...Another

The June Duke Energy Bill is in and the good news from last month is still coming in.  Let's just cut to the chase, shall we?

June 2012 Bill (May - June)

Energy Consumed:  689 kWh

Days in Bill:  33
Average Daily Consumption:  20.88 kWh/day
June 2012 Bill:  $75.51
Cooling Degree Days:  222 (every day had either an HDD or CDD).
Energy Usage per CDD:  3.10 kWh/CDD

June 2013 Bill (May 2 - June 4)

Energy Consumed:  431 kWh

Days in Bill:  33
Average Daily Consumption:  13.06 kWh/day (37.5% Reduction)
June 2012 Bill:  $50.93 ($24.58 bill savings)
Cooling Degree Days:  169 (22 days had CDDs)
Energy Usage per CDD:  1.70 kWh/CDD (45.2% Reduction)


So it's looking great...but not for long.  My June Bill would have been lower except my Mom flew in on the 30th as we had our baby shower on the 1st.  One of the things we had my mom do was start washing the baby clothes we've collected so far.  We had to do the same thing after shower with all the new clothes.  Needless to say, the clothes dryer was "cooking" and really uses a lot of electricity.

Help is on the way for that though...as Heat Pump Dryers are coming out...just not until 2014. However, they don't appear to have a good return on investment as of yet. But, I will say good ole' competition should drive down prices to make it more reasonable.  Remember my GE Geospring water heater?  When that come out initially, it was $2-2.5k each.  Now they are selling for $1k.  I would expect utilities to offer rebates on these unit also given the offer large power demand reduction.   But...only time will tell.


Monday, May 6, 2013

Ladies and Gentlemen...A New Record - May Bill

Earlier this month I was pretty excited and posted that I was figured I'd earn myself a new record month.  Well folks, I didn't think I'd do THIS good.  May's energy results are below:

May 2012 Bill
Total Energy Consumed:  609 kWh
Number of Billing Days:  29
Average Daily Energy Consumption:  21.0 kWh/day
Est. Heating Degree Days:  154 (19 days when HDDs were recorded)
Energy Usage per HDD:  2.59 kWh/HD
Billed:  $68.35

May 2013 (4/3 - 5/3) Bill
Total Energy Consumed:   359 kWh (New Monthly Record!)
Number of Billing Days:  30
Average Daily Energy Consumption:  11.97 kWh/day (New Monthly Record!)
% Reduction in Energy Consumption:  43%
Est. Heating Degree Days:  191 (20 days when HDDs were recorded)
Energy Usage per HDD:  1.49 kWh/HD
Billed: $44.69
Bill Savings:  $23.66


***APPLAUSE***

"Thank you...thank you....you're wonderful folks..."

These are fantastic numbers.  Not only was my energy consumption 43% less than in 2012, but I beat my previous energy low daily energy consumption record (October 2012) by 18% (~14% based on the monthly total). 

I would expect next month to produce similar results untill Summer decides to come early.  Generally speaking, it's been nice out and our HVAC system has been off.  Last weekend, my wife needed to turn on the heat because we had some chilly, rainy days.  But it's off again now. 

I think my next post, I'm going to run the numbers to see where my ROI stands with my Geothermal.  I know my initial assumptions were pretty rosey. 

One other reason why I'm thrilled about these results...the thought of getting close to Net Zero...at least on a monthly basis.  If  were to install 2kW of panels, using PVWatts, it looks like I would produce roughly 291 kWh/month. So I'd be 68 kWh shy of a net zero month.  That's a pretty awesome thought! 

Tuesday, April 16, 2013

On track for another record low month

My TED 5000 Dashboard (4/16/2013)


Yes...I'm a little excited right now...but it looks like I'm on track for a new record low month. 

Wait a second, you say?  But the picture above shows you using more than the last record month (October 2012). 

Hold onto your hats, I say!  This month started out cold and I was still using heat until about April 6/7th!  It's now ~10 days later and my heat is turned off.  Check out the Day History below... 

Historical Data
 
From the pic above in the Daily History you can see 2 days where I was below 10 kWh/day.  That one day (4/12) was my lowest energy usage day ever..and I was at home which includes the AM showers before work.  Granted, I will concede, both days I ate out (Thursday after Ultimate, Friday after golf).  Tuesday (10.3 kWh/d) and Wednesday (10.4 kWh/d) incldues cooking.   Either way, take the last week (Mon 4/9--> Sun 4/14)..I've averaged 11.96 kWh/d.
 
Well..through today, I've used an average of ~15.3 kWh/day (221 kWh).  I need to lower that to <14.6 kWh/day to equal my October 2012 record.   I would need to average 14.44 kWh/day for the next 15 days to match that record.  If I go conservative on my last weeks usage and I average 13 kWh/day for the next 15 days, then I'll average 13.88 kWh/day which will be a new record. 
 
***GIGGIDTY***
 
Stay tuned for the official results.
 
BTW...you may have noticed the TED Monthly Historical my March 2013 usage of 25,219 kWh.  Obviously this is a mistake given last months blog posting.  This is a bug in the TED5000 software whenever there's a power outage.  I'm not sure why but it registered that I used ~4,000 kWh from 3/18 (19:00 hours) to 3/19 (0:00 hours). The folks at Energy Inc (maker of the TED5000) know this and are working on a way to mitigate this issue (TED recognizes and skips or users edit it out or whatever).  It's pretty annoying, yes...and I hope it gets resolved soon.
 
Another Update...my TED 5000 display charging base broke the other day. This is a case where I can actually blame the cat for something (yes, that was the cat farting....not me....).  Shew was rubbing against the unit (happy kitty?) and it just fzzled and stopped working.  The display works fine when I take it out of the charger as it goes to battery mode.  But when I put it into the base, the screen goes blank.  Although my unit was out of warranty, I'm lucky enough that the base is only $15 to replace.  I contacted Energy Inc and a new one is in the mail. 
 

Thursday, April 4, 2013

April Bill - Good and Not So Bad?

Howdy Readers-

Another month has passed (roughly) since my last post.  Time sure flies by doesn't it?  Well, it's been a COLD spring so far down in the Southeast US.  Only in the past week has it finally been above 60F consistently.  I say this as I glance outside where its supposed to be a high of 48F, gloomy, and rainy all day.  *UGH* 

Although the forecast does call for sun this weekend with temperatures in the high 60s.  Yippie!

So...let's see where we ended up this month, shall we?

April 2012
Total Energy Consumption:  704 kWh
Number of Days:  32
Average Daily Consumption:  22.0 kWh/day
Heating Degree Days:  117  (note:  only 14 days actual had HDDs)
Energy Consumption per HDD:  2.63 kWh/HDD (based on 14 days)

April 2013 (Mar 4 - Apr 2)
Total Energy Consumption:  737 kWh
Number of Days:  29
Average Daily Consumption:  25.41 kWh/day
Changed versus previous year:  -15.5%
Bill Savings vs 2012 Consumption:  -$0.52
Heating Degree Days:  444  (note:  28 days actual had HDDs)
Energy Consumption per HDD:  1.60 kWh/HDD 
kWh/HDD Savings vs 2012:  39.1%

OK...so at first glance, I did worse than last year.  I used about 16% MORE energy, but luckily it only cost me a whopping $0.52 more.  I think I can deal.  However, when you factor how cold it was this year as opposed to last year, then I'm doing just fine.  If I include the HDDs, I was roughly 39% MORE EFFICIENT than last year. 

 I will say that this was tricky to look at because I had to make an "executive decision" on how to quantify days that had zero HDDs.  For the month of April 2012, if I included all 32 days in my calculation, then it would have said I used ~6 kWh/HDD.  Yes, that's a valid number, but its highly skewed because for nearly most of the month had no heating was needed so it's only looking at my "base" consumption at the time.  So that doesn't give a good indication.  So instead I only used the number of days an actual HDD was recorded.  I did the same for my 2013 values.  This brought the values more in line for as shown below:

2011-2012
12/2011 = 2.16 kWh/HDD
01/2012 = 2.45 kWh/HDD
02/2012 = 1.90 kWh/HDD
03/2012 = 2.14 kWh/HDD
04/2012 = 2.63 kWh/HDD

2012-2013
12/2012 = 1.82 kWh/HDD
01/2013 = 1.75 kWh/HDD
02/2013 = 1.73 kWh/HDD
03/2013 = 1.45 kWh/HDD
04/2013 = 1.60 kWh/HDD

OK...so this makes sense to me.  I'm trending as expected.  So I'm going to consider this a "minor" victory. 

I really don't have any energy efficiency projects in the near future.  Closest that once could even consider may be new window shades in the upstairs.  As we prepare the nursery for the arrival of our twins, I would like to put in some nicer shades than the cheap versions (old school pull down things that I can never get it to stay when I pull it down).  I was thinking about window films.  I tossed in an example link.   I get a little security benefit from it (you can't just smash a window anymore as the window film holds the glass in place...at least for a little while) not to mention some privacy too.  An then there's the potential energy savings too.  We'll see...I contacted my local firm to see how much it would cost.  I'm just curious right now...but if the price is right, I may do it.    I'll let y'all know... 


Monday, March 18, 2013

March Bill, Results, and Year-end Review


Anybody else out there sick of winter yet?  I certainly am.  I just looked up and this time last March we were easily into the low 70s every day.  I will admit that the last 2 days were B-E-A-UTIFUL.  But alas today, it's back to being cold (44F) with a drizzle.  Ugh...

Anyhow, below is the information from my March Duke Energy Bill:

March 2012 (February - March)
Energy Consumption: 1,051 kWh
Number of Days: 29 days
Average Daily Energy Consumption:  36.24 kWh/day
# of Heating Degree Days (HDD):  491
Unit Energy per HDD:  2.14 kWh/HDD

March 2013 (February - March)
Energy Consumption: 901 kWh
Number of Days: 28 days
Average Daily Energy Consumption:  32.18 kWh/day (11.21% reduction vs 2012)
# of Heating Degree Days (HDD):  620
Unit Energy per HDD:  1.45 kWh/HDD  (32% reduction vs 2012)
Bill Savings vs 2012 ($0.1093/kWh average rate) = $23.18

Fantastic...another month of savings even though it was colder outside!

So now it's time for my year end review.  Why does this come in March?  Well...that's because that's when we move in.  Below is a nice table comparison


2010-2011 (April - March)
Energy Consumption = 15,750 kWh
Days = 349
Average Daily Consumption = 45.13 kWh/day
Adjusted Annual Consumption = 16,472 kWh/yr
(adjusted to 365 days)

2011-2012 (April - March)
Energy Consumption = 10,930 kWh
Days = 366
Average Daily Consumption = 29.86 kWh/day
Adjusted Annual Consumption = 10,900 kWh/yr
Energy Reduction versus 2010 = 33.8%

2012-2013 (April - March)
Energy Consumption = 9,018 kWh
Days = 367
Average Daily Consumption = 24.57 kWh/day
Adjusted Annual Consumption = 8,969 kWh/yr
Energy Reduction versus 2011 = 17.7% 
Energy Reduction versus 2010 = 45.6% 
Bill Savings (adjusted rate) vs 2011 = $311.01

Wow...just wow.  You're with me on this, right?  Since I've moved in, I've been able to reduce my energy consumption by nearly 46%!  And if you compare against 2011 (the Geothermal was already installed), then you can see we've reduced our consumption by another 18%.  

Can I do better?  Well...probably not much more.  I'm guessing its going to be slim pickins' after this unless I start generating energy via solar panels.  If anything I'm expecting to see reductions throughout the spring/summer until I hit October 2013.  That's when I installed the new water heater and saw some fantastic energy reductions which is probably contributing heavily to my current results.

Until then..I'll enjoy my numbers while I still can.

Tuesday, March 5, 2013

Updated (Non-Official) HERs Rating

Unofficial HERs Index for my House

So the other day I was bored and came across my former HERs rating report completed last May.  The report showed my house had a rating of 71 which meant that it was ~55% more efficient than a typical existing home (HERs rating =130) and ~29% more efficient than a standard new home (HERs rating = 100).   Since I've done a whole bunch of projects since then (most notably the attic radiant barrier and the GE Geospring), I was curious what my new score would be.

So looking through the report, in the footer it noted that the report was completed using the "REM/Rate - Residential Energy Analysis and Rating Software v12.99".  Using Google, I input the information and found the website for the software.  As I hoped, they provided a download for the software.  So I downloaded v14.1.  It's a 90-day trial version that's full featured except I can't print anything.  That's fine by me...I'm just playing anyway.

Luckily, my previous energy auditor, AltruEnergy, had sent me the REM/Rate file for my house (*.blg).  This was great because it meant I didn't have to re-enter all the information from the report!  Time saver!  After opening the file and doing the all-important "Save-As", I verified that my previous HERs rating did not change (it didn't) and then I started updated.   I added the following:
  • Added in R-5 to the foundation walls for the XPS I added this winter.
  • Added in R-5 to the Rim and Band Joist via the XPS I added this winter (1st floor only).
    • Note:  I have not added ventilation to the crawl space yet.  I’m waiting for my spring tune-up.  At that time, my HVAC guy is going to install the new vent in the crawl space.  So I didn’t update that in the file.
  • Added in Radiant Barrier to the ceiling (all except the small vaulted part in the bonus room) which I installed last fall.
  • Updated water heater to be my GE Geospring (EF=2.4) which includes an extra R-10 blanket I added myself.   It also runs in series to maximize desuperheater production.
  • Updated the geothermal system such that only 1 unit has a desuperheater (only the downstairs unit has one).
  • Added in my new fridge.  I got one of those French door fridges.  Not only is it bigger than my old one, but it uses nearly half as much energy per year.
  • I updated the dishwater information to reflect the actually kWh/yr via the Energy Guide.
  •  I updated the dryer to have moisture sensing which it has.
  • I updated the clothes washer with the actual information for my unit via the Energy Guide.
  • I updated my lighting to be 100% CFL.  It’s really more like 80% CFL and 20% LED.  But there's no option for LED in the software.  My exterior and garage fixtures are all CFL also so I put those to be 100% compliant.
  • I updated the ceiling fan CFM/watt to ~92 CFM/watt.  We have 5 ceiling fans in the house, all of which are energy star.  The old file said we only had 1.  I actually replaced the one in my master bedroom (which we use nearly every night in the summer) with one of those DC motor ceiling fans.  It uses 327 CFM/watt…which is about 3x better than other energy star ceiling fans!  It’s still on clearance at Home Depot online (Hampton Bay Winfield).
The results are below (it's also in the pic above if you were paying attention)...drum roll please....
Unofficial Home Energy Rating (HER) Certificate  Note:  The NO PRINT is because I'm using the trial version.
My unofficial revised HERs rating is a 54.  Sweetness!  So I'm nearly 50% more efficient that a new standard home.  And by energy star standards, my house is house is ~30% more efficient than a new standard home...assuming an energy star home is 30% more efficient than a standard home which would give it a HERs rating of 70.  In case you're wondering from the certificate above, I don't actually use $1,379/yr for energy.  I'm much below that ($1,091).  The above number is scaled for a family of 5.  There's only 2 of us now, although soon we'll be close with twins on the way.

Side note:  I'm not advocating that anybody else do this...I'm just an Engi-nerd that enjoys tinkering.  I did send my file back to my Auditor for a QA/QC check...so I will say these results are preliminary.  Although I'm not sure he'll say anything definitive just because he probably doesn't want to advocate for folks to use this software who don't know what they are doing.  Being a modeler myself, I understand that when it comes to models,  "junk in = junk out".  So if you don't know what you are doing, you could just producing useless numbers.

One of the nice things about having the software is that I can run some scenarios for projects that I was contemplating.  These include:
  • Replacing the siding and including R-5 XPS insulation (continuous barrier)
  • Replacing the windows with new Low-e, Argon filled windows
  • Install Solar Panels
Replacing the siding and the windows is an expensive proposition.  The siding itself would be ~$15k while the windows would probably be another $10k. Well, the software essentially told me not to bother.  Adding in the extra R-5 on the outside walls only saved be $50/yr!  The windows were another $50.  Obviously, doing it for energy saving purposes does not make sense.  Maybe for the windows installing a window film would make more sense because its significantly cheaper and would reduce the solar heat gain in the summer and the heat loss in the winter.  The return on investment would be significantly better while providing a similar benefit, although definitely not as great.  But it would be a fraction of the cost...if you believe the websites it's 10% of the cost.  So $1k vs $10k.  That could be palatable for my wallet.

The only thing that did make sense was the solar panels....but I pretty much already knew that.  The panels lowered my HERs rating to a 43.  However, that's a $4-5k investment.