The May energy results are in. They are posted below. This week I should get my new TIGO gateway installed so once that is complete, I'll start posting better solar production numbers. Also, my HVAC guys (Panther HVAC) is going to upgrade my upstairs split unit from the Envision series to a 5-series with a desuperheater. Thus, I'll have the ability to generate hot water regardless of which system is running. Given that my upstairs split system runs 2:1 over the downstairs this should significantly increase the amount of hot water generated.
May 2013 Duke Energy Bill (May 3 - June 4)
Energy Consumption = 431 kWh
Billing Days = 33
Average Daily Energy Consumption = 13.06 kWh/day
Bill = $50.93
May 2014 Duke Energy Bill (May 1 - June 1)
Energy Consumption = 431 kWh (483 kWh used minus 118 kWh sent back to grid)
Solar Energy Produced = 233 kWh (TED5000 Estimate)
Billing Days = 31
Average Daily Energy Consumption = 11.77 kWh/day (9.85% reduction in energy consumption)
Bill = $49.42
Overall, those are some good numbers. I doubt I'll look positive for next month. The heat we've had lately has certainly increased our AC usage. It's pretty much been around 90s for the past 2 weeks straight. Ugh. Shoot, last month (May) we didn't even use the AC while last month we ran the upstairs system nearly 80hrs which is equivalent to what we typiclly see in June. Regardless, there's always 'ups and downs' in weather.
Have a Happy Independence Day!
Monday, June 30, 2014

Wednesday, May 28, 2014
Tigo Gateway 'fried', Desuperheater for upstairs, heat pump dryer
 |
| My Tigo Control Panel |
So the guys from Renu Energy (formerly GreenSpring Energy) came by to check out why my Tigo is broken again. After after 3 hours of work and constantly going from the roof to the attic to my bonus room (where the Tigo control panel is located), they finally gave up. Essentially they think the Gateway (located on the roof) is 'fried'. Tigo is going to send a new gateway to me which they'll exchange for my current one so they can try to diagnose what went wrong. I'll hopefully get the new unit in 1-2 weeks and Tigo will be up and running. Now, when I say fried...it just means that Tigo isn't transferring the data. I'm still getting solar power generation, so that's good. And I think I'm still getting the benefit of of the Tigo, just not the data. So stay tuned for more info.
OK...next up, desuperheaters. One thing that's always annoyed me was that my geothermal install only had 1 desuperheater located on my downstairs unit. And over the summer and swing seasons I always felt that the upstairs unit ran far longer than the downstairs unit for A/C. Recall...the longer the runtime for A/C, the more hot water is generated from the desuperheater. Well, i just confirmed this using the Ecobees. Overall, the upstairs unit runs 2.2x more than the downstairs units when the A/C is running. Thus, I'm missing out on ~70% of the potential hot water generation. Bah! So I'm looking into getting a desuperheater for my upstairs unit. I've contacted my HVAC guys (Panther HVAC) to see what they recommend as I'm unused if I'd be looking at a WaterFurnace related unit or if I should go with an aftermarket unit (such as the Turbotec Enviro-Pak). Stay tuned for more info once I get a reply back from Turbotec on their price along with a reply from my HVAC folks.
BTW...for folks that have a normal heat pump or A/C, you can use the Turbotec system to generate hot water too. You don't need a geotrhermal system to do it. It's just useful to hopefully have your airhandler and your water heater near to each other.
BTW...for folks that have a normal heat pump or A/C, you can use the Turbotec system to generate hot water too. You don't need a geotrhermal system to do it. It's just useful to hopefully have your airhandler and your water heater near to each other.
One final thing...I just saw that LG has released the first heat pump dryer in the US. Hooray! It's 50-60% more efficient at drying than a conventional dryer. As of now, my dryer is by far the largest energy consumer in my house. The only thing bigger is my emergency heat for the geothermal system and that should never run...except well for emergencies, which hasn't happened. Unfortunately, it's priced at $1,600 (MSRP) so hopefully prices will drop soon. Not to mention, I don't need a new washer/dryer as I highly doubt there's any ROI unless I have to replace my unit anyway.
Wednesday, May 21, 2014
Feb/March/April Energy Bill. And Tigo broken again...
Hi Folks-
Yes, I've been a bad slacker. The kiddos are crawling now which means they are all over the place. There's essentially really no such thing as free time anymore. If you were in the Southeast this year, you'll know that its been pretty dang odd outside. In April there were times where I needed heat for a couple of days...then I needed A/C for a couple days, and for the rest, I didn't need anything. At least recently (May) I haven't needed any heat. I'm trying like hell not to run the A/C and instead opening the windows. But the humidity keeps creeping up which means eventually I have to give in. At a minimum, I'm only running the upstairs system. The downstairs is staying nice and cool.
Anyhow...without further ado...below are the numbers for February, March and April.
February 2013 (Feb 4 - Mar 4)
Energy Consumption: 901 kWh
Number of Billing days: 28
Average daily Consumption: 32.18 kWh/day
Degree Days: 620
Average Daily Usage/Degree Day: 1.45 kwh/DD
Billing Amount: $91.68
February 2014 (Feb 1 - Mar 1)
Energy Consumption: 919 kWh (estimated)
Solar Generated to Grid: 135 kWh (estimated from TED5000)
Net Energy Consumption: 784 kWh
Number of Billing days: 28
Average daily Consumption: 28.00 kWh/day (13% reduction)
Degree Days: 543
Average Daily Usage/Degree Day: 1.44 kwh/DD
Billing Amount: $87.91 ($11.75 monthly savings)
****
March 2013 (March 4 - April 2)
Energy Consumption: 737 kWh
Number of Billing days: 29
Average daily Consumption: 25.41 kWh/day
Degree Days: 444
Average Daily Usage/Degree Day: 1.60 kwh/DD
Billing Amount: $77.46
March 2014 (March 1 - April 1)
Energy Consumption: 1,112 kWh (estimated)
Solar Generated to Grid: 183 kWh (high estimate from TED5000)
Net Energy Consumption: 929 kWh
Number of Billing days: 31
Average daily Consumption: 29.97 kWh/day (17.9% increase in usage)
Degree Days: 456
Average Daily Usage/Degree Day: 1.60 kwh/DD
Billing Amount: $101.19 ($19.67 increase in cost) *Rate increase vs 2013
****
April 2013 (April 2 - May 3)
Energy Consumption: 359 kWh
Number of Billing days: 30
Average daily Consumption: 11.97 kWh/day
Degree Days: 161
Average Daily Usage/Degree Day: 1.49 kwh/DD
Billing Amount: $44.69
April 2014 (April 1 - May 1)
Energy Consumption: 493 kWh
Solar Generated to Grid: 109 kWh
Net Energy Consumption: 385 kWh
Number of Billing days: 30
Average daily Consumption: 12.83 kWh/day (7.24% increase in usage)
Degree Days: 183
Average Daily Usage/Degree Day: 1.97 kwh/DD
Billing Amount: $51.24 ($11.53 increase in cost) *Rate increase vs 2013
While February I was able to reduce costs, I got bit in the butt for March and April. What surprised me was how the HDDs were the same as last year. It sure didn't feel like it. In April, I'm in my lowest energy usage period (swing month). So you can clearly see the 'kid penalty' (those extra loads of laundry, extra dishes, bath-time, etc). But it's not like it's THAT bad. I will say that in March, we did get a new freezer for the garage. It's 3x the size of the old one, but only uses about 50% more energy than the previous. So this adds an additional 1 kWh/day to my bill roughly.
How are the solar panels doing? Well so far we're about 124 kWh lower than projected. One thing that is really annoying is that Tigo is broken again. I contacted Greenspring already, but I need to follow-up with them so they can come out. I'm betting its that dang connection coming loose in the attic again. That's a bad place to have wires spliced together because it has such an extra temperature range (110F --> Teens). Thus, copper wiring is going to expand/shrink a lot.
Yes, I've been a bad slacker. The kiddos are crawling now which means they are all over the place. There's essentially really no such thing as free time anymore. If you were in the Southeast this year, you'll know that its been pretty dang odd outside. In April there were times where I needed heat for a couple of days...then I needed A/C for a couple days, and for the rest, I didn't need anything. At least recently (May) I haven't needed any heat. I'm trying like hell not to run the A/C and instead opening the windows. But the humidity keeps creeping up which means eventually I have to give in. At a minimum, I'm only running the upstairs system. The downstairs is staying nice and cool.
Anyhow...without further ado...below are the numbers for February, March and April.
February 2013 (Feb 4 - Mar 4)
Energy Consumption: 901 kWh
Number of Billing days: 28
Average daily Consumption: 32.18 kWh/day
Degree Days: 620
Average Daily Usage/Degree Day: 1.45 kwh/DD
Billing Amount: $91.68
February 2014 (Feb 1 - Mar 1)
Energy Consumption: 919 kWh (estimated)
Solar Generated to Grid: 135 kWh (estimated from TED5000)
Net Energy Consumption: 784 kWh
Number of Billing days: 28
Average daily Consumption: 28.00 kWh/day (13% reduction)
Degree Days: 543
Average Daily Usage/Degree Day: 1.44 kwh/DD
Billing Amount: $87.91 ($11.75 monthly savings)
****
March 2013 (March 4 - April 2)
Energy Consumption: 737 kWh
Number of Billing days: 29
Average daily Consumption: 25.41 kWh/day
Degree Days: 444
Average Daily Usage/Degree Day: 1.60 kwh/DD
Billing Amount: $77.46
March 2014 (March 1 - April 1)
Energy Consumption: 1,112 kWh (estimated)
Solar Generated to Grid: 183 kWh (high estimate from TED5000)
Net Energy Consumption: 929 kWh
Number of Billing days: 31
Average daily Consumption: 29.97 kWh/day (17.9% increase in usage)
Degree Days: 456
Average Daily Usage/Degree Day: 1.60 kwh/DD
Billing Amount: $101.19 ($19.67 increase in cost) *Rate increase vs 2013
****
April 2013 (April 2 - May 3)
Energy Consumption: 359 kWh
Number of Billing days: 30
Average daily Consumption: 11.97 kWh/day
Degree Days: 161
Average Daily Usage/Degree Day: 1.49 kwh/DD
Billing Amount: $44.69
April 2014 (April 1 - May 1)
Energy Consumption: 493 kWh
Solar Generated to Grid: 109 kWh
Net Energy Consumption: 385 kWh
Number of Billing days: 30
Average daily Consumption: 12.83 kWh/day (7.24% increase in usage)
Degree Days: 183
Average Daily Usage/Degree Day: 1.97 kwh/DD
Billing Amount: $51.24 ($11.53 increase in cost) *Rate increase vs 2013
While February I was able to reduce costs, I got bit in the butt for March and April. What surprised me was how the HDDs were the same as last year. It sure didn't feel like it. In April, I'm in my lowest energy usage period (swing month). So you can clearly see the 'kid penalty' (those extra loads of laundry, extra dishes, bath-time, etc). But it's not like it's THAT bad. I will say that in March, we did get a new freezer for the garage. It's 3x the size of the old one, but only uses about 50% more energy than the previous. So this adds an additional 1 kWh/day to my bill roughly.
How are the solar panels doing? Well so far we're about 124 kWh lower than projected. One thing that is really annoying is that Tigo is broken again. I contacted Greenspring already, but I need to follow-up with them so they can come out. I'm betting its that dang connection coming loose in the attic again. That's a bad place to have wires spliced together because it has such an extra temperature range (110F --> Teens). Thus, copper wiring is going to expand/shrink a lot.
| PVWatts | SolarEye | Expected | Actual | ||
| Generation | DeRate | Generation | Generation | ||
| Month | kWh/mo | % | kWh/mo | kWh/mo | Notes |
| 1 | 223 | 52% | 116.0 | 135 | TED5000 estimate. Tigo broken |
| 2 | 221 | 72% | 159.1 | 135 | TED5000 estimate. Tigo broken |
| 3 | 282 | 77% | 217.1 | 183 | TED5000 estimate. Tigo broken |
| 4 | 299 | 83% | 248.2 | 209 | TED5000 estimate. Tigo broken |
| 5 | 293 | 83% | 243.2 | ||
| 6 | 277 | 82% | 227.1 | ||
| 7 | 273 | 82% | 223.9 | ||
| 8 | 278 | 82% | 228.0 | ||
| 9 | 254 | 82% | 208.3 | ||
| 10 | 270 | 75% | 202.5 | ||
| 11 | 220 | 66% | 145.2 | 96.21 | Energized Nov 7th. Fully Operational Nov 11th. |
| 12 | 205 | 47% | 96.4 | 99.37 | |
| Total | 3095 | 74.8% | 2315 | ||
| Expected | Actual | Diff | |||
| To Date: | 981.9 | 857.58 | 124.4 |
Thursday, March 13, 2014
FeBRRRuary Bill...
Hi all. Wow..I gotta say sometimes is takes FOREVER for Duke Energy to get the dang bill out. For the longest time I've known how much I owe...but they had not produced a bill to show consumption.
Overall between Jan and Feb it was COLD. A lot colder than I can remember. You'll see below that the HDDs were 1.5x what was last year and 2012. Yikes! And the bill reflects it too. Also note that Duke Energy raise their rates late last year\ too.
Regardless...below are the results:
January 3rd - February 4th, 2013 Bill
Total consumption: 1,050 kWh
Days in billing cycle = 32
Average Daily Consumption = 32.81 kWh/day
Degree days = 606
Consumption per HDD = 1.73 kWh/HDD
Bill = $104.62
January 1st - February 1st, 2014 Bill
Total consumption: 1,438 kWh
Total Solar Generated: 135 kWh (TED5000)
Total Solar back to grid: 29 kWh
Net Consumption: 1,409 kWh
Days in billing cycle = 31
Average Daily Consumption = 45.45 kWh/day (38.52% increase)
Degree days = 906 (149% increase)
Consumption per HDD = 1.56 kWh/HDD (10.24% decrease)
Bill = $145.16
So, while overall we had a huge increase in average daily energy consumption (~39%) compared to last year, factoring in the significantly bitter cold temperatures shows we had an overall 10% reduction in energy usage.
Comparing the solar generation to what was expected shows actual generation at 135 kWh while the estimated generation was listed as 116 kWh. So that's good. However, in February it looks like I produced less power than what was predicted. For a combo of Jan&Feb, I produced 270 kWh while it predicted 275 kWh. A 1.9% error? I'm OK with that...
FYI, I got January's data from my TED5000 as my Tigo system is not generating data. The Tigo unit says "No Gateway Detected!". The contractor will check out the gateway today to figure out what is going on. Luckily, its not inhibiting me from producing power.
BTW...Tigo makes you PAY to view your own generated data after an apparent "honeymoon" period. This is very annoying as the Tigo website is very sly and not straightforward that a normal homeowner would have to pay. It reads as if only large scale systems need to pay since they would need the advanced features. It's not expensive ($5/year), but it pissed me off regardless. Also the contractor did not tell me of this either which is doubly annoying.
Overall between Jan and Feb it was COLD. A lot colder than I can remember. You'll see below that the HDDs were 1.5x what was last year and 2012. Yikes! And the bill reflects it too. Also note that Duke Energy raise their rates late last year\ too.
Regardless...below are the results:
January 3rd - February 4th, 2013 Bill
Total consumption: 1,050 kWh
Days in billing cycle = 32
Average Daily Consumption = 32.81 kWh/day
Degree days = 606
Consumption per HDD = 1.73 kWh/HDD
Bill = $104.62
January 1st - February 1st, 2014 Bill
Total consumption: 1,438 kWh
Total Solar Generated: 135 kWh (TED5000)
Total Solar back to grid: 29 kWh
Net Consumption: 1,409 kWh
Days in billing cycle = 31
Average Daily Consumption = 45.45 kWh/day (38.52% increase)
Degree days = 906 (149% increase)
Consumption per HDD = 1.56 kWh/HDD (10.24% decrease)
Bill = $145.16
So, while overall we had a huge increase in average daily energy consumption (~39%) compared to last year, factoring in the significantly bitter cold temperatures shows we had an overall 10% reduction in energy usage.
| PVWatts | SolarEye | Expected | Actual | ||
| Generation | DeRate | Generation | Generation | ||
| Month | kWh/mo | % | kWh/mo | kWh/mo | Notes |
| 1 | 223 | 52% | 116.0 | 135 | TED5000 estimate |
| 2 | 221 | 72% | 159.1 | 135 | TED5000 estimate |
| 3 | 282 | 77% | 217.1 | ||
| 4 | 299 | 83% | 248.2 | ||
| 5 | 293 | 83% | 243.2 | ||
| 6 | 277 | 82% | 227.1 | ||
| 7 | 273 | 82% | 223.9 | ||
| 8 | 278 | 82% | 228.0 | ||
| 9 | 254 | 82% | 208.3 | ||
| 10 | 270 | 75% | 202.5 | ||
| 11 | 220 | 66% | 145.2 | 96.21 | Energized Nov 7. Fully Online Nov 11. |
| 12 | 205 | 47% | 96.4 | 99.37 | |
| Total | 3095 | 74.8% | 2315 |
FYI, I got January's data from my TED5000 as my Tigo system is not generating data. The Tigo unit says "No Gateway Detected!". The contractor will check out the gateway today to figure out what is going on. Luckily, its not inhibiting me from producing power.
BTW...Tigo makes you PAY to view your own generated data after an apparent "honeymoon" period. This is very annoying as the Tigo website is very sly and not straightforward that a normal homeowner would have to pay. It reads as if only large scale systems need to pay since they would need the advanced features. It's not expensive ($5/year), but it pissed me off regardless. Also the contractor did not tell me of this either which is doubly annoying.
Wednesday, January 22, 2014
January Bill
Hi All...long time no blog, eh? Yeah, the kiddos are keeping me busy and there's a bunch of things I'd like to blog about, but I just haven't gotten around to it. Regardless, I'm back now with the latest energy results. Shall we begin?
January 2013 Duke Energy Bill
Energy Consumed = 940 kWh
Billing Days = 31
Average Daily Consumption = 30.32 kWh/day
Heating Degree Days = 538
Energy per HDD = 1.75 kWh/HDD
Bill = $95.84
January 2014 Duke Energy Bill (Dec 1 - Jan 1)
Energy Consumed = 1,020 kWh
Solar Energy Back to the Grid = 33 kWh (99.4Next kWh total generated)
Net Energy Usage = 987 kWh
Billing Days = 31
Average Daily Consumption = 31.84 kWh/day (5% increase in usage)
Heating Degree Days = 577
Energy per HDD = 1.71 kWh/HDD (2.3% reduction in usage)
Bill = $103.55 ($0.13 savings vs 2012 due to the higher rate)
Overall, I used about 5% more energy than 2013. However, factoring in the colder weather, I was roughly the same with 2.3% reduction. I'll take that. I'm even OK with the 5% increase at face value. Overall, I'd say sticking within 5% error is pretty darn good with the introduction of the twins to the family.
Next month is ugly, as TED5000 is reporting that I'm averaging 44.7 kWh/day. I'm sitting at 923 kWh used to date which extrapolates to ~1390 kWh/month. Yikes! Mind you much of that is due to the bitter cold we've been experiencing. In 2013 we had 606 HDD. We're CURRENTLY at 558 HDDs with 10 more days to go (including today). And we're averaging 23 HDD/day (already removing the 4 coldest days). That'll put this month at 788 HDDs! That would explain the significant increase in usage (HVAC related). And 1390/788 = 1.76 kWh/HDD which is generally on par with what I've been reporting.
Thursday, January 2, 2014
Solar Panel Update - How close to expected?
Happy New Year everyone! Well, now that the new year is upon us and I finally have a full month of data collection, I can look at how well my solar installation has performed compared to what was expected. Be mindful that this really only 1 month of data. The true test will be once we get a full year of data. But I'm gonna show y'all anyway.
First let's get some of the background, shall we? Below is a pic of what PV Watts estimated my house should get. This is the same information that my Solar Contractor, Greenspring Energy, gave to me.
 |
| PV Watts Information |
 |
| Monthly SolarEye Information |
As you'll notice, due to shading, I should expect at most, 75% of the unimpeded values with February- October getting the best results (72-83%) and November-January getting significantly lower (47-66%). December is the worst month with only 47%.
Wait...never seen one of these things? Well, essentially what they do is take this fisheye camera thingy (yes, "thingy" is a technical term) and put it on multiple points on your roof where it takes a picture and overlays how the sun will track across it. See the picture below:
 |
| SunEye Report for One of my Locations. |
OK...enough of that tangent...so getting back to the discussion, now let's look at my generation (from the Tigo website):
 |
| Tigo Energy Recordings |
 |
| Comparison of Expected vs Actual Solar Power Generation |
I'll try to remember to post this similar information for each month in addition to my Duke Energy information. If I can, I'll try to combine the two when I can.
Any thoughts out there?
Thursday, December 19, 2013
December Bill, No November?, Overall: Still doing OK
Happy Holidays! Merry Christmas! Happy Hanukkah!
(Insert any other holiday you wish to celebrate)
 |
| My daughter wonders what Santa is going to bring her for Christmas... |
If you've been keeping track, you may be saying..."uhh December? What happened to November?" Well...for some reason Duke Energy did not send me a bill. And I cannot find my November information online except for what Duke wants to bill me. It's as if November never existed. Unfortunately, Duke Energy would not take the actual dollar value of the bill and make that disappear too. In any event in the lack of actual data, I'll post what my TED5000 unit says I did. So...without further ado...below my November and December usage data.
November 2012 (Oct 2 - Nov 1)
Energy Consumed = 509 kWh
Billing Days = 30
Average Daily Usage = 16.97 kWh/day (Ranks as #5 best month ever)
Heating/Cooling Degree Days = 217
Weather Normalized Usage = 2.35 kWh/HD
Bill =$58.14
Energy Consumed = 651 kWh
Billing Days = 31
Average Daily Usage = 21.0 kWh/day (24% increase in usage)
Heating/Cooling Degree Days = 191 (minus 15 days where there were <5 CDD/HDD)
Weather Normalized Usage = 1.76 kWh/HD
Bill =$64.02 (from Duke Energy. TED Estimate = $78.19).
Based on the Bill amount, I'm guessing TED was WAY off. At $0.11/kWh, my usage should be in the neighborhood of 560 kWh comparing to 2012. That's a 20% error. If you compare October's Bill, TED says I used 746 kWh while my Bill said I used 595 kWh which adjusts up to 664 kWh adjusting for the bill having 28 days and TED having 31 days. So TED is about 15-20% off on those two months.
December 2012 (Nov 1- Dec 3)
Energy Consumed = 970 kWh
Billing Days = 32
Average Daily Usage = 30.31 kWh/day
Heating/Cooling Degree Days = 533
Weather Normalized Usage = 1.82 kWh/HD
Bill =$98.52
Energy Consumed = 951 kWh
Energy Produced = 45 kWh <--Panels energized midday 11/4, but not producing fully until midday 11/11.
Net Energy Consumed = 906 kWh
Billing Days = 34
Average Daily Usage = 26.65 kWh/day (12.1% reduction from 2012)
Heating/Cooling Degree Days = 530
Weather Normalized Usage = 1.71 kWh/HD
Bill =$96.66
The good news here is that without factoring in the solar panels, I used less energy in 2013 than I did in 2012. And that's with roughly the same Heating Degree Days. Including the energy I generated, easily puts me at well below my 2012 usage by ~12%. So far this month, according to TED, I'm on a similar pace to be just right around my 2012 consumption without the solar panels. Apparently, the weather has been similar to last year also. Through yesterday, the preliminary weather data is showing we've used 310 HDDs or 17.22 HD/day. Extrapolating to 32 days, we're on pace for 551 HDDs compared to 533 in 2012.
Monday, November 11, 2013
Tigo Energy Maximizer
 |
| Tigo Energy Maximizer |
So I've finally got my Tigo system working. It took a while for Greenspring Energy to get it running. Part of the issue was that there was a communication issue with 2 (of 6) panels. This communication issue for some reason meant that TIGO would not generate my login information. That also confirmed a suspicion I had after I was watching the inverter (before Tigo and TED) only produce ~1.1 kW of power on a beautiful cloudless sunny day. Once the communication issue was fixed (Greenspring sent over 2 technicians to diagnose and fix) the system was up and running at nearly maximum potential. And I could finally login to Tigo.
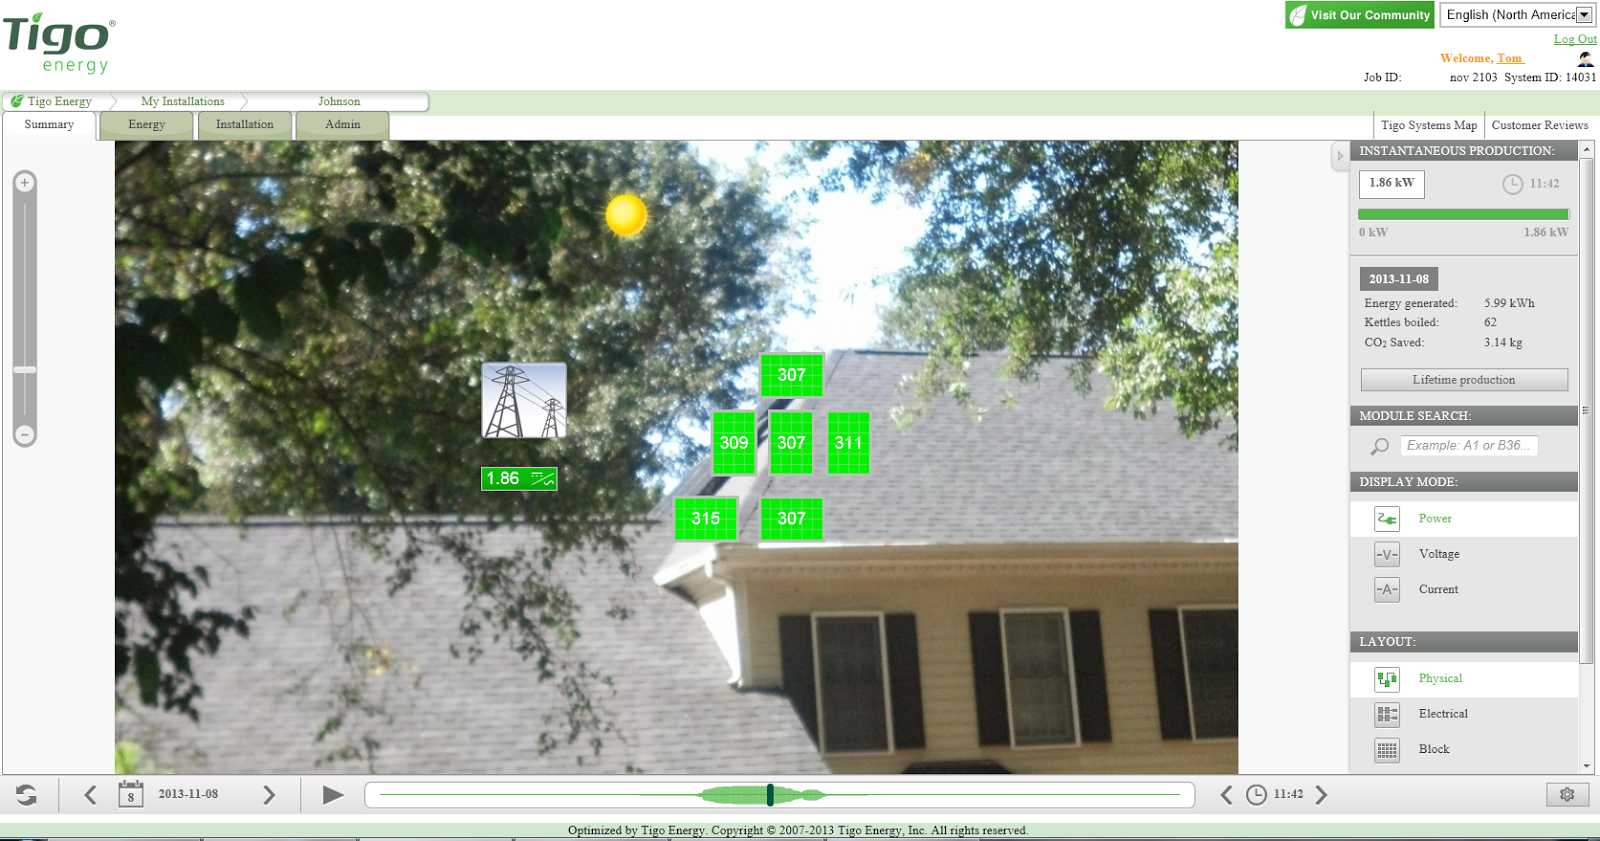
So...why Tigo? Well, long story short, Tigo was an alternative to microinverters such as Enphase. It essentially allows each panel to operate individually such that if there was any shading (i.e. trees, squirrels, random cloud) then it would only affect that panel and not the entire string. My two pics below show how the TIGO is allowing my system to have panels operating at different powers which is maximizing my power output.
 |
| Tigo online information (no shading). System is producing 94.8% of its max potential. |
 |
| Tigo online information showing one panel shaded. Without Tigo, I would have been producing 474W instead of 1,510W |
***NERDY ELECTRICAL ENGINEERING LESSON STARTING NOW***
Why is that? Well...solar panels are wired in series. So on one 300W panel, for instance, let's say we have 60 individual solar cells. Each one of those cells, at optimal conditions would produce 5W such that 60 x 5W = 300W. Well, because they are wired in series, if one cell becomes partially shaded and only produces 1W, then due to the bottle-neck, ALL the cells will only produce 1W (1W x 60 = 60W). It doesn't matter if that cells is the first cell or the last cell in the series...then will all be bottle-necked. And the same goes for hooking up multiple solar panels. Bummer, huh?
The reason they do this is just the laws of electricity (I know there's a better name, but I don't have time to look it up). So Power = Voltage x amperage. Well for the same power, if you hook everything up in parallel, then the voltage remains constant. Thus as you add more 'power', then the amperage must go up. Alternatively, if you install everything in series, the amperage stays the same and thus, as power goes up, voltage goes up.
So why not hook up panels in parallel? Well...the more amperage you have the larger the wire you need to have. Ever look in your breaker box? Check out the varying size of the wires. The wires that enter the box from your electricity meter are HUGE (200 amps, 240V) compared to those that exit and go to, say, a normal outlet (120V, 15amp). Well...think about that for each solar panel. Those wires cannot be 'fished' easily through walls or down conduit. And those wires are expensive because there's a lot of copper in them. See the following table (sorry for the headings not lining up with the rows...not sure why it copied that way). Most likely your house is fed using either and 2/0 or 3/0 AWG cable while a normal circuit in your house is probably a 10 or a 14 AWG.
AWG
|
Diameter
|
Area
[mm2] |
Resistance
Ohms / 1000 ft |
Resistance
** Ohms / km |
Max Current
***
|
Max Frequency
for 100%
skin depth
|
|||||||||
0000 (4/0)
|
0.46
|
11.684
|
107
|
0.049
|
0.16072
|
302
|
125 Hz
|
||||||||
000 (3/0)
|
0.4096
|
10.40384
|
85
|
0.0618
|
0.202704
|
239
|
160 Hz
|
||||||||
00 (2/0)
|
0.3648
|
9.26592
|
67.4
|
0.0779
|
0.255512
|
190
|
200 Hz
|
||||||||
0 (1/0)
|
0.3249
|
8.25246
|
53.5
|
0.0983
|
0.322424
|
150
|
250 Hz
|
||||||||
4
|
0.2043
|
5.18922
|
21.2
|
0.2485
|
0.81508
|
60
|
650 Hz
|
||||||||
6
|
0.162
|
4.1148
|
13.3
|
0.3951
|
1.295928
|
37
|
1100 Hz
|
||||||||
8
|
0.1285
|
3.2639
|
8.37
|
0.6282
|
2.060496
|
24
|
1650 Hz
|
||||||||
10
|
0.1019
|
2.58826
|
5.26
|
0.9989
|
3.276392
|
15
|
2600 Hz
|
||||||||
14
|
0.0641
|
1.62814
|
2.08
|
2.525
|
8.282
|
5.9
|
6700 Hz
|
||||||||
Well a 10 AWG wire might be $1/ft at Lowes while a 2/0 AWG wire is $6.50/ft. That's a big cost difference if you have to run a wire 100-ft to get from the roof to your breaker box. And at 0.50" DIA try bending that 2/0 wire to get around a corner.
Just doing the math, using the pic above where the panels were producing 1.86 kW, that's roughly 310W/panel or 52V @ 6amp. Running in series, that's a 6amps and 310V using a 10 AWG wire. Running in parallel that's 52V @ 36 amps which would require a 4 AWG wire.
OK...enough of the electrical engineering lesson. Hopefully it was semi-informative even though it was basic.
Friday, November 8, 2013
Too much excitement not to share...
 |
| Screenshot from my TED5000 |
OK...so this week I received my extra TED5000 MTU and clamps and installed them so I can finally see what I'm producing. It took me a bit to figure out how to get it setup appropriately though. Once I installed the unit and checked with the software, all my readings went negative (it was 8pm at night...no sunshine). I double checked my installation and it was all appropriate. Then I read in the forums, that I needed to removed and flip the clamps on the 'whole house' wires and that did the trick. Once I did that then the readings were all correct. Then, it was cloudy. Dang! Well, today the sun is shining brightly and I'm finally getting to see my system producing power (I knew it was, but now I can see it remotely). Yes...I am a nerd.
From the screenshot above (11am EST) my system was producing 1.702kW while peak production is 1.962kW while I was only using about 100W, so I'm sending power to the grid, baby!
Sometime today I should get my login information for TIGO and I'll post on that. I'll save that saga for another post, but long story short, there was a communication error from 2 of my panels (~660W NOT producing) and Greenspring energy had to send out a technician to fix it (all panels are now producing power). With that fixed, TIGO can communicate and I'll be able to view the real time info on each panel.
Subscribe to:
Posts (Atom)